VIX related products (ETNs, futures and options) are becoming popular financial instruments, for both hedging and speculation, these days. The volatility index VIX was developed in the early 90’s. In its early days, it led the derivative markets. Today the dynamics has changed. Now there is strong evidence that the VIX futures market leads the cash index.
In this post we are going to look at some statistical properties of the spot VIX index. We used data from January 1990 to May 2017. Graph below shows the kernel distribution of spot VIX.
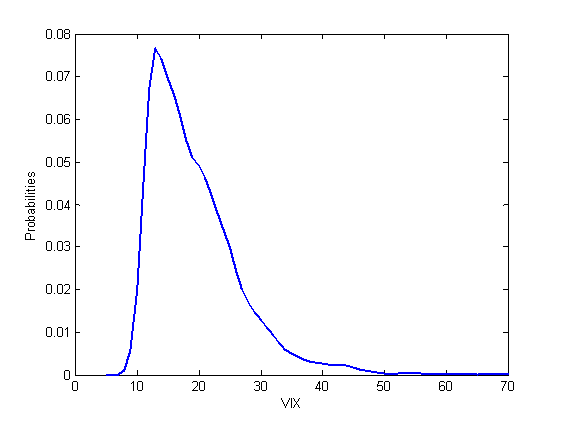
It can be seen that the distribution of spot VIX is not normal, and it possesses a right tail.
We next look at the Q-Q plot of spot VIX. Graph below shows the Q-Q plot. It’s apparent that the distribution of spot VIX is not normal. The right-tail behavior can also be seen clearly. Intuitively, it makes sense since the VIX index often experiences very sharp, upward spikes.
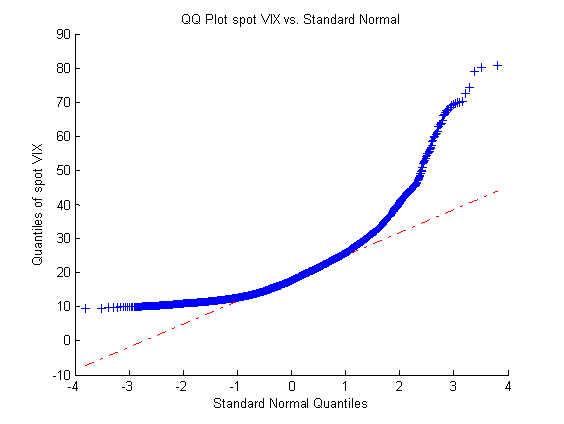
It is interesting to observe that there exists a natural floor around 9% on the left side, i.e. historically speaking, 9% has been a minimum for spot VIX.
We now look at the distribution of VIX returns. Graph below shows the Q-Q plot of VIX returns. We observe that the return distribution is closer to normal than the spot VIX distribution. However, it still exhibits the right tail behavior.
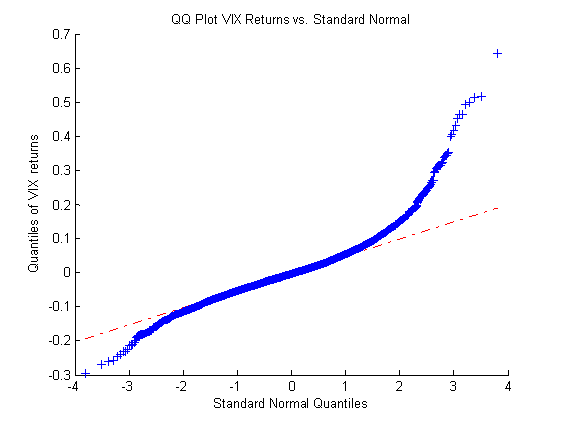
It’s interesting to see that in the return space, the VIX distribution has a left tail similar to the equity indices. This is probably due to large decreases in the spot VIX after sharp volatility spikes.
The natural floor of the spot VIX index and its left tail in the return space can lead to construction of good risk/reward trading strategies.
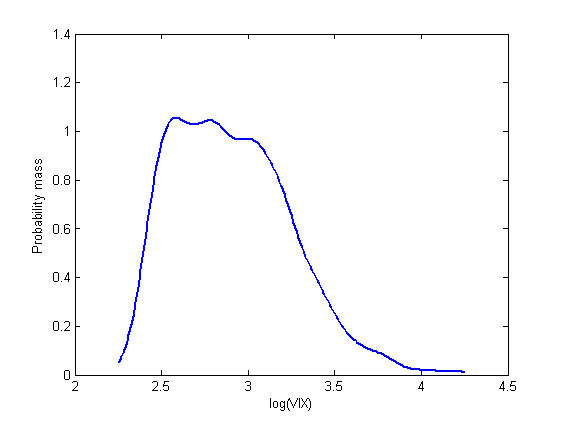
UPDATE: we plotted probability mass function of spot VIX on the log scale. Graph below shows that spot VIX spent most of its time in the 12%-22% (log(VIX)=2.5 to 3.1) region during the sample period.