Last year, we presented backtested results for a VXX trading strategy. The system’s logic is based upon the concept of volatility risk premium. In short, the trading rules are as follows:
Buy (or Cover) VXX if 5D average of (VIX index -10D HV of SP500) < 0
Sell (or Short) VXX if 5D average of (VIX index -10D HV of SP500)>0
The strategy performed well in backtest. In this follow-up post, we look at how it has performed since last year. The Table below summarizes the results
| All trades | Long trades | Short trades | |
| Initial capital | 10000 | 10000 | 10000 |
| Ending capital | 3870.55 | 9095.02 | 4775.53 |
| Net Profit | -6129.45 | -904.98 | -5224.47 |
| Net Profit % | -61.29% | -9.05% | -52.24% |
| Exposure % | 100.00% | 14.67% | 85.33% |
| Net Risk Adjusted Return % | -61.29% | -61.68% | -61.23% |
| Annual Return % | -60.50% | -8.86% | -51.48% |
| Risk Adjusted Return % | -60.50% | -60.42% | -60.33% |
| All trades | 11 | 5 (45.45 %) | 6 (54.55 %) |
| Avg. Profit/Loss | -557.22 | -181 | -870.74 |
| Avg. Profit/Loss % | -3.35% | -4.40% | -2.47% |
| Avg. Bars Held | 24.55 | 8.6 | 37.83 |
| Winners | 6 (54.55 %) | 2 (18.18 %) | 4 (36.36 %) |
| Total Profit | 2366.97 | 365.38 | 2001.59 |
| Avg. Profit | 394.49 | 182.69 | 500.4 |
| Avg. Profit % | 13.75% | 6.46% | 17.40% |
| Avg. Bars Held | 32.5 | 7.5 | 45 |
| Max. Consecutive | 2 | 2 | 2 |
| Largest win | 1308.08 | 239.26 | 1308.08 |
| # bars in largest win | 102 | 8 | 102 |
| Losers | 5 (45.45 %) | 3 (27.27 %) | 2 (18.18 %) |
| Total Loss | -8496.42 | -1270.36 | -7226.06 |
| Avg. Loss | -1699.28 | -423.45 | -3613.03 |
| Avg. Loss % | -23.87% | -11.64% | -42.21% |
| Avg. Bars Held | 15 | 9.33 | 23.5 |
| Max. Consecutive | 2 | 2 | 1 |
| Largest loss | -6656.33 | -625.51 | -6656.33 |
| # bars in largest loss | 29 | 11 | 29 |
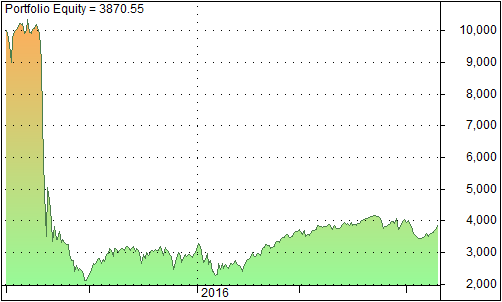
The strategy produced 11 trades with 6 trades (55%) being winners. However, it suffered a big loss during August. The graph below shows the portfolio equity since last August.

Large losses are typical of short volatility strategies. An interesting observation is that after the large drawdown, the strategy has recovered, as depicted by the upward trending equity line after August. This is usually the case for short volatility strategies.
Despite the big loss, the overall return (not shown) is still positive. This means that the strategy has a positive expectancy. Drawdown can be minimized by using a correct position size, stop losses, and a good portfolio allocation scheme. Another solution is to construct limited-loss positions using VXX options.

What does a 5D avg of a 10D HV mean?
Are you saying that if we were to calculate the 10D historical volatility, on a daily basis, we should average out the values for the 10D HV over 5 days and use it to compare against VIX?
Thanks for asking. Actually it’s 5D average of (VIX- 10 D HV)
Got it. Thank you for taking the time to read my comment and for the clarification.
I apologize, I might have left my reply incomplete. I am still a little confused, since I have been trying to plot your series.
In your equation of (VIX – 10D HV), I am assuming that it’s the 10 D Avg. of the historical volatility. Is that correct?
Assuming that’s what you meant, how will a (VIX – 10D HV) ever be greater than the VIX (assuming that VIX index is the same as VIX)?
I am missing something really basic here in trying to plot the series for buy and sell points…
Thanks in advance.
I just updated the buy and sell description. Hope it makes sense this time