The VIX index is an important market indicator that everyone is watching. VVIX, on the other hand, receives less attention. In this post, we are going to take a look at the relationship between the VIX and VVIX indices.
While the VIX index measures the volatility risks, VVIX measures the volatility-of-volatility risks. Its calculation methodology is similar to the VIX’s except that instead of using SPX options it uses VIX options.
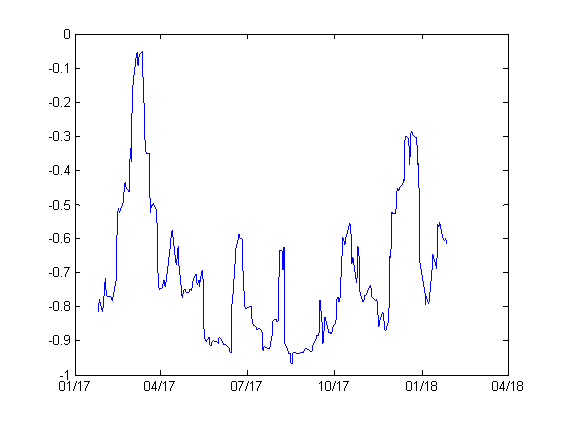
To study the relationship between these 2 indices, we first calculated the rolling 20-days correlation of the VIX and VVIX returns from January 2007 to March 2020. The median value of correlation is 0.807 and 25% quantile is 0.66
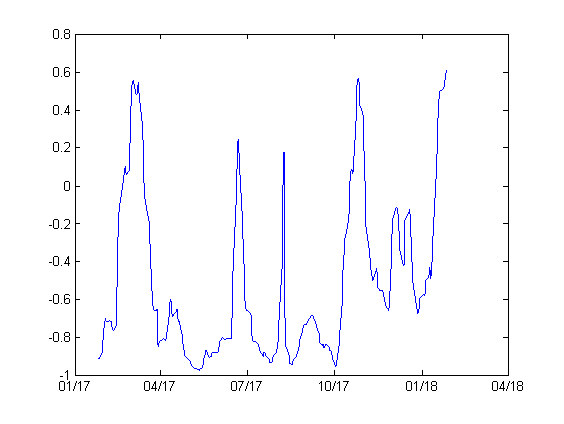
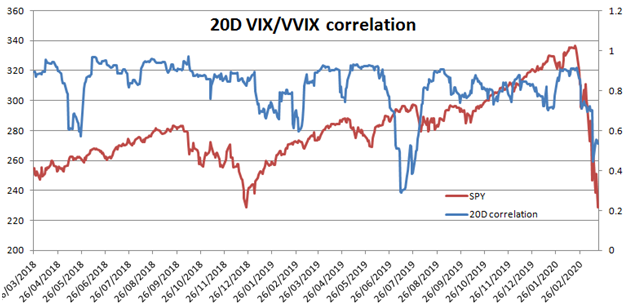
The figure below presents the rolling 20-days VIX/VVIX correlation for the last 2 years. We also superimposed SPY on the chart. We observe that the correlation is usually high but there are periods where it decreases significantly. The current period is one of those.
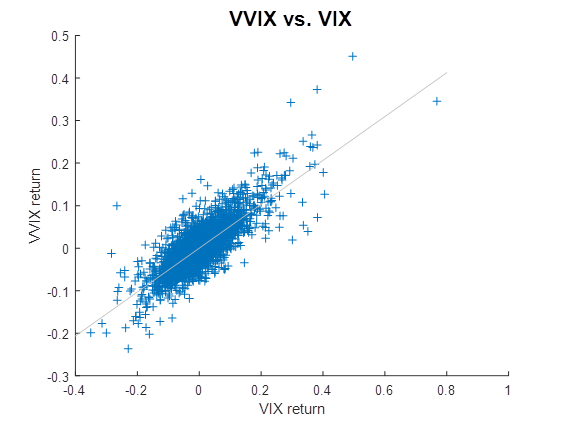
The next figure shows the scatter plot of VVIX returns vs. VIX returns. It’s observed that there is a significant population where VIX and VVIX returns are of opposite signs. We subsequently calculated the number of instances where VIX and VVIX move in the opposite direction. This indeed happens 22% of the time.
Some implications of this study are:
- Although the correlation between VIX and VVIX appears to be high, there is a significant number of instances where VIX and VVIX move in the opposite direction. So it’s fair to say that VVIX follows separate price dynamics which is different from the VIX. In other words, VVIX prices in different risks.
- Long VIX options or SPX back spreads are not always a good hedge for an equity portfolio. The hedge can break down.
- At times it’s cheaper to hedge a long equity portfolio using SPX options; at times it’s cheaper using VIX options.
- The speed of VIX mean reversion is greater when VIX is high as compared to when VIX is low.
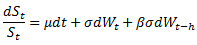
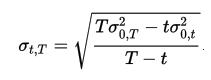
 and in case β=0 the price dynamics becomes GBM.