When trading options, we often use the VIX index as a measure of volatility to help enter and manage positions. This works most of the time. However, there exist some differences between the VIX index and at-the-money implied volatility (ATM IV). In this post, we are going to show such a difference through an example. Specifically, we study the relationship between the implied volatility and forward realized volatility (RV) [1] of SP500. We utilize data from April 2009 to December 2018.
Recall that the VIX index
- Is a model-independent measure of volatility,
- It contains a basket of options, including out-of-the-money options. Therefore it incorporates the skew effect to some degree.
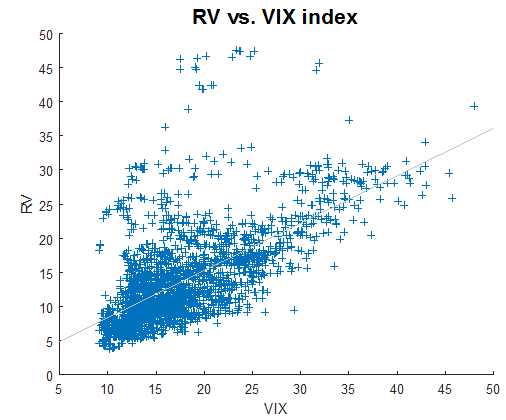
Plot below shows RV as a function of the VIX index.

We observe that a high VIX index will usually lead to a higher realized volatility. The correlation between RV and the VIX is 0.6397.
For traders who manage fixed-strike options, the use of option-specific implied volatilities, in conjunction with the VIX index, should be considered. In this example, we calculate the one-month at-the-money implied volatility using SPY options. Unlike the VIX index, the fixed-strike volatilities are model-dependent. To simplify, we use the Black-Scholes model to determine the fixed-strike, fixed-maturity implied volatilities. The constant-maturity, floating-strike implied volatilities are then calculated by interpolation.
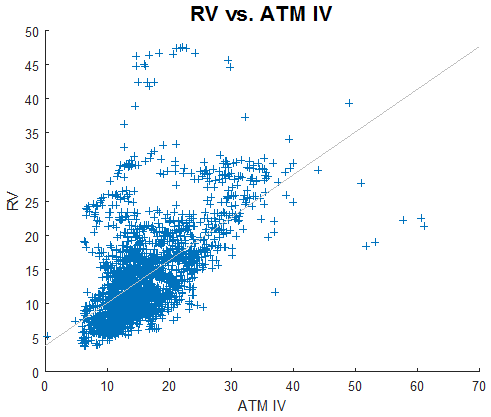
Plot below shows RV as a function of ATM IV.

We observe similar behaviour as in the previous plot. However, the correlation (0.5925) is smaller. This is probably due to the fact that ATM IV does not include the skew.
In summary:
- There are differences between the VIX index and at-the-money implied volatility.
- Higher implied volatilities (as measured by the VIX or ATM IV) will usually lead to higher RV.
Footnotes
[1] In this example, forward realized volatility is historical volatility shifted by one month.

Would be good to also see the chart for the VIX vs ATM IV.
Thanks for the suggestion. Will do when I write a follow-up