In previous blog posts, we explored the possibility of using various volatility indices in designing market timing systems for trading VIX-related ETFs. The system logic relies mostly on the persistent risk premia in the options market. Recall that there are 3 major types of risk premium:
1-Implied/realized volatilities (IV/RV)
2-Term structure
3-Skew
A summary of the systems developed based on the first 2 risk premia was published in this post.
In this article, we will attempt to build a trading system based on the third type of risk premium: volatility skew. As a measure of the volatility skew, we use the CBOE SKEW index.
According to the CBOE website, the SKEW index is calculated as follows,
The CBOE SKEW Index (“SKEW”) is an index derived from the price of S&P 500 tail risk. Similar to VIX®, the price of S&P 500 tail risk is calculated from the prices of S&P 500 out-of-the-money options. SKEW typically ranges from 100 to 150. A SKEW value of 100 means that the perceived distribution of S&P 500 log-returns is normal, and the probability of outlier returns is therefore negligible. As SKEW rises above 100, the left tail of the S&P 500 distribution acquires more weight, and the probabilities of outlier returns become more significant. One can estimate these probabilities from the value of SKEW. Since an increase in perceived tail risk increases the relative demand for low strike puts, increases in SKEW also correspond to an overall steepening of the curve of implied volatilities, familiar to option traders as the “skew”.
Our system’s rules are as follows:
Buy (or Cover) VXX if SKEW >= 10D average of SKEW
Sell (or Short) VXX if SKEW < 10D average of SKEW
The table below summarizes important statistics of the trading system
| Initial capital | 10000 |
| Ending capital | 40877.91 |
| Net Profit | 30877.91 |
| Net Profit % | 308.78% |
| Exposure % | 99.50% |
| Net Risk Adjusted Return % | 310.34% |
| Annual Return % | 19.56% |
| Risk Adjusted Return % | 19.66% |
| Max. system % drawdown | -76.00% |
| Number of trades | 538 |
| Winners | 285 (52.97 %) |
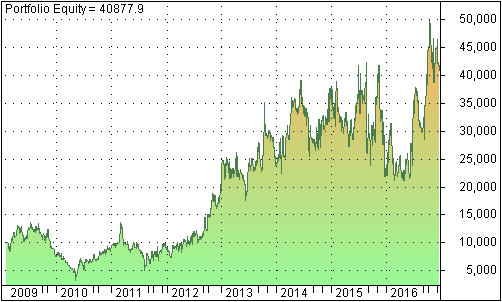
The graph below shows the equity line from February 2009 to December 2016

We observe that this system does not perform well as the other 2 systems [1]. A possible explanation for the weak performance is that VXX and other similar ETFs’ prices are affected more directly by the IV/RV relationship and the term structure than by the volatility skew. Hence using the volatility skew as a timing mechanism is not as accurate as other volatility indices.
In summary, the system based on the CBOE SKEW is not as robust as the VRP and RY systems. Therefore we will not add it to our existing portfolio of trading strategies.
Footnotes
[1] We also tested various combinations of this system and results lead to the same conclusion.
