
It is well known that persistent biases exist in various markets. For example, in the tennis market, there exists a longshot bias. Similarly, financial markets exhibit a persistent bias called the risk premium. Formally, the risk premium is defined as
where EQ denotes the expectation value of X, a stochastic variable, in the risk-neutral world, and EP denotes the expectation value of X in the real world. X can be, for example, commodity prices, FX rates, etc. See reference 1 for a thorough discussion of various risk premia in financial markets.
Of our particular interest is the case where X is the realized volatility (RV) of a stock or stock index. The risk premium in this case is often called volatility (or variance) risk premium (VRP). If we substitute X in the above equation with the RV of SP500, then EQ (RV) becomes the VIX index, and the VRP becomes VIX- EP (RV).
Traders often try to exploit the VRP by trading listed options or OTC variance swaps. Another way to harvest the VRP is through trading VIX -based Exchange Trade Funds such as VXX. In this post we explore the latter possibility.
The most difficult problem when designing a VRP-based trading strategy is that EP(RV), which is needed in order to calculate the VRP, is not observable. The best we can do is to use a quantitative method to estimate it.
Reference 2 tested various forms of EP(RV) estimate: GARCH, historical volatilities (HV). The author found that 10-day HV is the most effective. They then further smoothed out the HV by using a 5-day moving average in order to avoid whipsaws. The trading rules are as follows:
Buy (or Cover) VXX if VIX index <= 5D average of 10D HV of SP500
Sell (or Short) VXX if VIX index > 5D average of 10D HV of SP500
The Table below summarizes the trading strategy’s statistics. The starting capital is $10000. It is fully invested in each trade
| All trades | Long trades | Short trades | |
| Initial capital | 10000 | 10000 | 10000 |
| Ending capital | 727774.91 | -74688.89 | 812463.8 |
| Net Profit | 717774.91 | -84688.89 | 802463.8 |
| Net Profit % | 7177.75% | -846.89% | 8024.64% |
| Exposure % | 99.02% | 6.58% | 92.44% |
| Net Risk Adjusted Return % | 7248.42% | -12868.01% | 8680.57% |
| Annual Return % | 93.38% | N/A | 96.68% |
| Risk Adjusted Return % | 94.29% | N/A | 104.58% |
| All trades | 43 | 21 (48.84 %) | 22 (51.16 %) |
| Avg. Profit/Loss | 16692.44 | -4032.8 | 36475.63 |
| Avg. Profit/Loss % | 12.04% | 2.34% | 21.29% |
| Avg. Bars Held | 38.79 | 6.14 | 69.95 |
| Winners | 32 (74.42 %) | 12 (27.91 %) | 20 (46.51 %) |
| Total Profit | 918340.82 | 94671.52 | 823669.31 |
| Avg. Profit | 28698.15 | 7889.29 | 41183.47 |
| Avg. Profit % | 18.13% | 8.45% | 23.93% |
| Avg. Bars Held | 47.47 | 5.92 | 72.4 |
| Max. Consecutive | 9 | 5 | 8 |
| Largest win | 198505.33 | 36704.45 | 198505.33 |
| # bars in largest win | 78 | 7 | 78 |
| Losers | 11 (25.58 %) | 9 (20.93 %) | 2 (4.65 %) |
| Total Loss | -200565.92 | -179360.41 | -21205.5 |
| Avg. Loss | -18233.27 | -19928.93 | -10602.75 |
| Avg. Loss % | -5.69% | -5.82% | -5.10% |
| Avg. Bars Held | 13.55 | 6.44 | 45.5 |
| Max. Consecutive | 3 | 4 | 1 |
| Largest loss | -38701.76 | -38701.76 | -16516.3 |
| # bars in largest loss | 4 | 4 | 41 |
| Max. trade drawdown | -300537.33 | -38701.76 | -300537.33 |
| Max. trade % drawdown | -46.12% | -12.49% | -46.12% |
| Max. system drawdown | -331363.27 | -164250.75 | -300537.33 |
| Max. system % drawdown | -52.21% | -95.16% | -64.93% |
| Recovery Factor | 2.17 | -0.52 | 2.67 |
| CAR/MaxDD | 1.79 | N/A | 1.49 |
| RAR/MaxDD | 1.81 | N/A | 1.61 |
| Profit Factor | 4.58 | 0.53 | 38.84 |
| Payoff Ratio | 1.57 | 0.4 | 3.88 |
| Standard Error | 56932.62 | 32093.21 | 72795.73 |
| Risk-Reward Ratio | 1.67 | -0.46 | 1.51 |
| Ulcer Index | 12.97 | 111.97 | 11.45 |
| Ulcer Performance Index | 6.78 | N/A | 7.97 |
| Sharpe Ratio of trades | 1.46 | 1.36 | 1.71 |
| K-Ratio | 0.0775 | -0.0214 | 0.07 |
We observe that the short trades are profitable while the long ones lost money. The CARG is 93.4%, which is high, but so is the drawdown of -52%. The graph below shows the portfolio equity
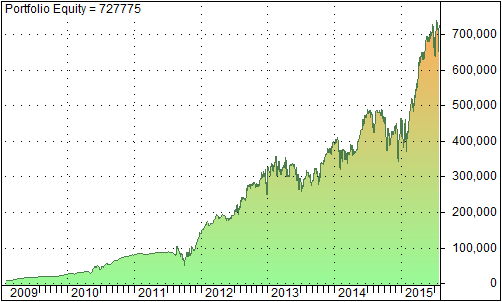
In summary, the VRP can be harvested through VIX ETF. However the drawdown is high. This strategy is viable if it is part of an asset allocation scheme. It would enhance the portfolio risk-adjusted return if we allocate, for example, 10% of our portfolio to this strategy, and the rest to equity and fixed income investments.
References
[1 ] A. Ilmanen, Expected Returns: An Investor’s Guide to Harvesting Market Rewards, John Wiley & Sons , 2011
[2] T Cooper, Easy Volatility Investing, SSRN, 2013