
In the previous installment, we discussed the use of a popular asset allocation/market timing rule (10M SMA rule hereafter) to size a short option position. The strategy did not work well as it was the case in traditional asset allocation. We thought that the poor performance was due to the fact that the 10M SMA rule is more of a market direction indicator that is not directly related to the PnL driver of a delta hedged position.
Recall that an option position can be loosely divided into 2 categories: dynamic and static [1]
1-Dynamic: the option position is delta hedged dynamically; its PnL driver is the implied/realized volatility dynamics. The profit and loss at the option expiration depends on the volatility dynamics, but not on the terminal value of the spot price.
2-Static: the option position is left unhedged; the payoff of the strategy depends on the spot price at option expiration but not on the volatility dynamics, i.e. it’s path independent.
In this post, we will apply the 10M SMA rule to a static, unhedged position. All other parameters and rules are the same as in our previous post. Briefly, the trading rules are as follows
1-NoTiming: Sell 1-Month at-the-money (ATM) put option, no rehedge.
2-10M-SMA: we only sell an ATM put option if the closing price of the underlying is greater than its 10M SMA.
Our rationale for investigating this case is that because the payoff of a static, unhedged position depends largely on the direction of the market, the 10M SMA timing rule will have a higher chance of success.
Table below summarizes and compares results of the short put strategy with and without the application of the 10M SMA rule
| Strategy | NoTiming | 10M-SMA |
| Number of Trades: | 115 | 81 |
| Percent Winners: | 0.77 | 0.77 |
| Average P&L: | 65.69 | 62.77 |
| Largest losing trade | -2702.50 | -1601.00 |
| Largest winning trade | 652.00 | 451.50 |
| Profit Factor (W/L): | 1.47 | 1.54 |
| Worst drawdown | -5002.50 | -1897.00 |
Graph below shows the equity curves of the 2 strategies
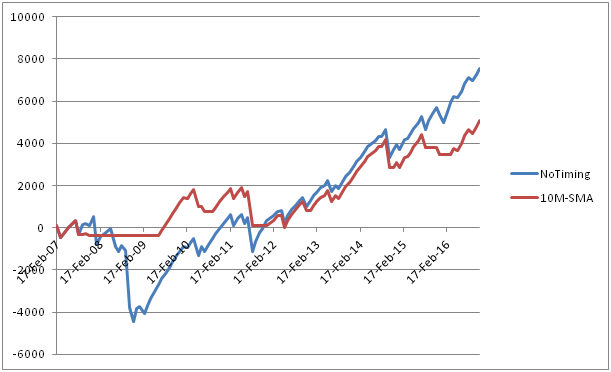
As we can see from the Table and Graph, the 10M SMA rule performed better in this case. Although the win percentage and average PnL per trade remained approximately the same, the risks have been reduced significantly. The largest loss was reduced from $2.7K to $1.6K; drawdown decreased from $5K to $1.9K. As a result, the profit factor increased from 1.47 to 1.54.
In conclusion, the 10M SMA rule performs well in the case of a static, unhedged short put position. Using this rule, the risk-adjusted return of the trade was enhanced significantly.
Other related studies:
- While researching the literature on this subject, I came across a similar study presented by E. Sinclair [2]. He showed that, for a delta hedged short strangle position, market timing based on the VIX index improved the results significantly. Since the VIX is a measure of volatility, its good performance is consistent with our understanding that for a delta hedged position, we should use a market timing indicator based on volatility and not on direction.
- Pavel Bambásek also published similar studies recently. He used 200-Days SMA to time the market: http://www.bluetrader.cz/delta-hedging-ano-ne/
References
[1] N.N. Taleb, Dynamic Hedging: Managing Vanilla and Exotic Options, Wiley, 1997
[2] E. Sinclair, Volatility Trading, Wiley, 2nd edition, 2013