
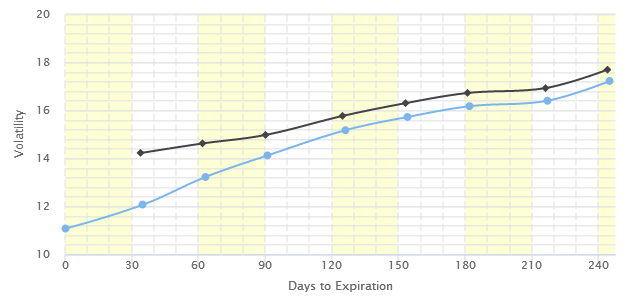
Last Wednesday, the SP500 index went down by just -1.8%, but in the volatility space it felt like the world was going to end; the volatility term structure, as measured by the VIX/VXV ratio, reached 1, i.e. the threshold where it passes from the contango to backwardation state. The near inversion of the volatility term structure can also be seen on the VIX futures curve (although to a lesser degree), as shown below.
With only -1.8% change in the underlying SPX, the associated spot VIX went from 10.65 to 15.59, a disproportional increase of 46%. The large changes in the spot and VIX futures were also reflected in the prices of VIX ETNs. For example, SVXY went down by about 18%, i.e. 9 times bigger than the SPX return. We note that in normal times SVXY has a beta of about 3-4 (as referenced to SPY).
So was the spike in volatility normal and what happened exactly?
To answer these questions, we first looked at the daily percentage changes of the VIX as a function of SPX returns. The Figure below plots the VIX changes v.s. SPX daily returns. Note that we plotted only days in which the underlying SPX decreased more than 1.5% from the previous day’s close. The arrow points to the data point of last Wednesday.
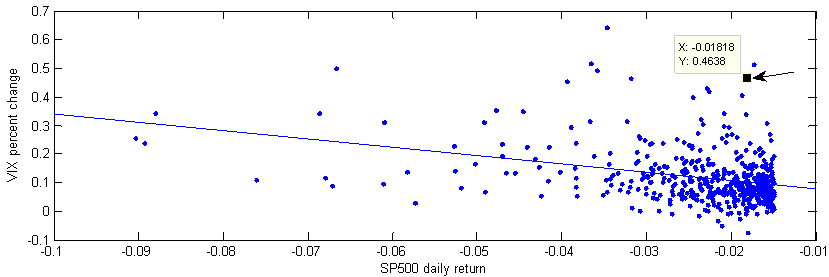
A cursory look at the graph can tell us that it’s rare that a small change in the underlying SPX caused a big percentage change in the VIX.
To quantify the probability, we counted the number of occurrences when the daily SPX returns are between -2.5% and -1.5%, but the VIX index experienced an increase of 30% or greater. The data set is from January 1990 to May 19 2017, and the total sample size is 6900.
There are only 11 occurrences, which means that volatility spikes like the one of last Wednesday occurred only about 0.16% of the time. So indeed, such an event is a rare occurrence.
Table below presents the dates and VIX changes on those 11 occurrences.
| Date | VIX change |
| 23/07/1990 | 0.515 |
| 03/08/1990 | 0.4068 |
| 19/08/1991 | 0.3235 |
| 04/02/1994 | 0.4186 |
| 30/05/2006 | 0.3086 |
| 27/04/2010 | 0.3057 |
| 25/02/2013 | 0.3402 |
| 15/04/2013 | 0.432 |
| 29/06/2015 | 0.3445 |
| 09/09/2016 | 0.3989 |
| 17/05/2017 | 0.4638 |
But what happened and what caused the VIX to go up that much?
While accurate answers must await thorough research, based on other results (not shown) and anecdotal evidences we believe that the rise in the popularity of VIX ETNs, and the resulting exponential increase in short interest, has contributed greatly to the increase in the volatility of volatility.
We also note that from the Table above, out of the 11 occurrences, more than half (6 to be precise) happened after 2010, i.e. after the introduction of VIX ETNs.
With an increase in volatility of volatility, risk management became more critical, especially if you are net short volatility and/or you have a lot of exposure to the skew (dGamma/dSpot).