
The spot VIX index finished last Friday at 11.28, a relatively low number, while the SKEW index was making a new high. The SKEW index is a good proxy for the cost of insurance and right now it appears to be expensive. A high reading of SKEW means investors are buying out of the money puts for protection.
With the cost of insurance so high, is there a less expensive way for investors to hedge their portfolios?
One might think immediately of cross-asset hedging. However, if we use other underlying to hedge, we will then take on correlation (basis) risk and if not managed correctly, it can add risks to the portfolio instead of protecting it.
In this post we examine different hedging strategies using instruments on the same underlying. Our goal is to investigate the cost, risk/reward characteristics of each hedging strategy. Knowing the risk/reward profiles will allow us to design a cost-effective portfolio-protection scheme.
We will use Monte Carlo (MC) simulation to accomplish our goal [1]. The parameters and assumptions of the MC simulation are as follows:
| Parameter | Value |
| Initial stock price | 100 |
| Volatility | 20% |
| Risk-free rate | 0.02 |
| Drift | 0.07 |
| Days in simulation | 252 |
| Time step (day) | 1 |
| Number of paths | 10000 |
| Model | GBM [2] |
The hedging strategies we’re investigating are:
1-NO HEDGE: no hedging is performed. The asset is allowed to evolve freely in a risky world. This would correspond to the portfolio of a Buy and Hold investor.
2-PPUT: protective put. We buy an at the money (ATM) put in order to hedge the downside. This strategy is the most common type of portfolio insurance.
3-GAMMA: convexity hedge. We buy an ATM put, but we then dynamically hedge it. This means that we flatten out the delta at the end of every day.
The GAMMA hedging strategy is not used frequently in the industry. The rationale for introducing it here is that given a high price of a put option, we will try to partially recoup its cost by actively scalping gamma, while we still benefit from the positive convexity of the option. This means that in case of a market correction, the gamma will manufacture negative delta so that the hedging position can offset some of the loss in the equity portfolio.
We use 10000 paths in our MC simulation. At the end of 1 year, we calculate the returns (using a Reg-T account) and determine its mean and variance. We also calculate the Value at Risk at 95% confidence interval. The graph below shows the histogram of the returns for the NO HEDGE strategy,
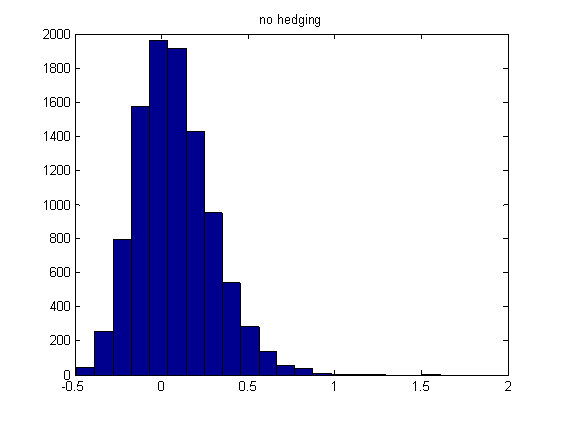
Table below presents the expected returns, standard deviations and Value at Risks for the hedging strategies.
| Strategies | Expected return | Standard Deviation | Value at Risk |
| NO HEDGE | 0.075 | 0.048 | 0.318 |
| PPUT | 0.052 | 0.024 | 0.118 |
| GAMMA | 0.066 | 0.029 | 0.248 |
As it is observed from the table, hedging with a protective put (PPUT) reduces the risks. Standard deviation and VaR are reduced from 0.048 and 0.318 to 0.024 to 0.118 respectively. However, the expected return is also reduced, from 0.075 to 0.052. This reduction is the cost of the insurance.
Interestingly, hedging using gamma convexity (GAMMA strategy) provides some reduction in risks (Standard deviation of 0.029, and VaR of 0.248), while not diminishing the returns greatly (expected return of 0.066).
In summary, GAMMA hedging is a strategy that is worth considering when designing a portfolio insurance scheme. It’s a good alternative to the often used protective (and expensive) put strategy.
Footnotes
[1] We note that the simulations were performed under idealistic assumptions, some are advantageous, and some are disadvantageous compared to a real life situation. However, results and the conclusion are consistent with our real world experience.
[2] GBM stands for Geometric Brownian Motion.