
In previous 2 articles, we explored a volatility trading strategy based on the volatility risk premium (VRP). The strategy performed well up until August 2015, and then it suffered a big loss during the August selloff.
In this article, we explore another volatility trading strategy, also discussed in Ref [1]. This strategy is based on the volatility term structure [2].
It is well known that volatilities exhibit a term structure which is similar to the yield curve in the interest rate market. The picture below depicts the volatility term structure for SP500 as at August 31 2016 [3].
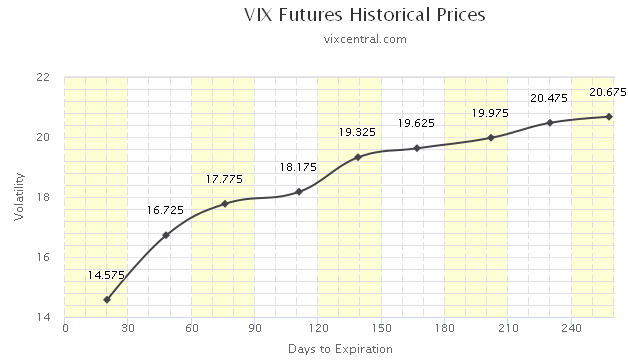
Most of the time the term structure is in contango. This means that the back months have higher implied volatilities than the front months. However, during a market stress, the volatility term structure curve usually inverts. In this case we say that the volatility term structure curve is in backwardation (a similar phenomenon exists in the interest rate market which is called inversion of the yield curve).
The basic idea of the trading strategy is to use the state (contango/backwardation) of the volatility term structure as a timing mechanism. Specifically, we go long if the volatility term structure is in backwardation and go short otherwise. To measure the slope of the term structure, we use the VIX and VXV volatility indices which represent the 1M and 3M implied volatilities of SP500 respectively.
The trading rules are as follows,
Buy (or Cover) VXX if 5-Day Moving Average of VIX/VXV >=1 (i.e. backwardation)
Sell (or Short) VXX if 5-Day Moving Average of VIX/VXV < 1 (i.e. contango)
The Table below presents the results
| All trades | Long trades | Short trades | |
| Initial capital | 10000 | 10000 | 10000 |
| Ending capital | 177387.15 | 19232.01 | 168155.15 |
| Net Profit | 167387.15 | 9232.01 | 158155.15 |
| Net Profit % | 1673.87% | 92.32% | 1581.55% |
| Exposure % | 99.44% | 6.64% | 92.80% |
| Net Risk Adjusted Return % | 1683.22% | 1390.38% | 1704.17% |
| Annual Return % | 46.07% | 9.00% | 45.05% |
| Risk Adjusted Return % | 46.33% | 135.54% | 48.54% |
| All trades | 30 | 15 (50.00 %) | 15 (50.00 %) |
| Avg. Profit/Loss | 5579.57 | 615.47 | 10543.68 |
| Avg. Profit/Loss % | 13.29% | 2.29% | 24.28% |
| Avg. Bars Held | 64.53 | 9.8 | 119.27 |
| Winners | 14 (46.67 %) | 4 (13.33 %) | 10 (33.33 %) |
| Total Profit | 208153.11 | 36602.85 | 171550.26 |
| Avg. Profit | 14868.08 | 9150.71 | 17155.03 |
| Avg. Profit % | 36.58% | 25.17% | 41.14% |
| Avg. Bars Held | 129.64 | 14.25 | 175.8 |
| Max. Consecutive | 3 | 1 | 4 |
| Largest win | 71040.59 | 18703.17 | 71040.59 |
| # bars in largest win | 157 | 35 | 157 |
| Losers | 16 (53.33 %) | 11 (36.67 %) | 5 (16.67 %) |
| Total Loss | -40765.96 | -27370.84 | -13395.12 |
| Avg. Loss | -2547.87 | -2488.26 | -2679.02 |
| Avg. Loss % | -7.09% | -6.02% | -9.45% |
| Avg. Bars Held | 7.56 | 8.18 | 6.2 |
| Max. Consecutive | 5 | 6 | 2 |
| Largest loss | -9062.89 | -8222.29 | -9062.89 |
| # bars in largest loss | 6 | 8 | 6 |
| Max. trade drawdown | -28211.89 | -15668.21 | -28211.89 |
| Max. trade % drawdown | -23.97% | -18.20% | -23.97% |
| Max. system drawdown | -32794.28 | -26555.13 | -37915.18 |
| Max. system % drawdown | -50.07% | -90.85% | -34.31% |
| Recovery Factor | 5.1 | 0.35 | 4.17 |
| CAR/MaxDD | 0.92 | 0.1 | 1.31 |
| RAR/MaxDD | 0.93 | 1.49 | 1.41 |
| Profit Factor | 5.11 | 1.34 | 12.81 |
| Payoff Ratio | 5.84 | 3.68 | 6.4 |
| Standard Error | 12109.91 | 6401.13 | 12526.9 |
| Risk-Reward Ratio | 1.49 | 0.15 | 1.36 |
| Ulcer Index | 11.25 | 42.48 | 8.24 |
| Ulcer Performance Index | 3.62 | 0.08 | 4.81 |
| Sharpe Ratio of trades | 0.8 | 0.53 | 0.97 |
| K-Ratio | 0.0745 | 0.0073 | 0.0683 |
The graph below shows the portfolio equity from 2009 up to August 2016.
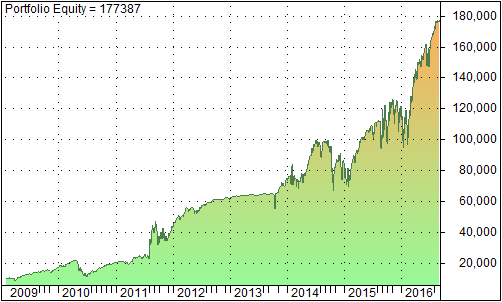
The annual rerun is 46% and the drawdown is 50%. There are 2 interesting observations
- This strategy did not suffer a large loss like the VRP strategy during the August selloff of last year
- Long volatility trades are profitable
In the next installment we will compare the 2 strategies, volatility risk premium and roll yield, in details.
References
[1] T Cooper, Easy Volatility Investing, SSRN, 2013
[2] Note that there is a so-called term structure risk premium in the options market that is not often discussed in the literature. The strategy discussed in this post, however, is not meant to exploit the term structure risk premium. It uses the term structure as a timing mechanism.
[3] The volatility term structure presented here is calculated based on VIX futures, which are the expectation values of 30-day forward implied volatility. Therefore, it is theoretically different from the term structure of spot volatilities which are calculated from SP500 options. Practically speaking, the 2 volatility term structures are highly correlated, and we use the futures curve in this article for illustration purposes.