Position sizing and portfolio allocation have not received much attention in the options trading community. In this post we are going to apply a simple position sizing rule and see how it performs within the context of volatility trading.
An option position can be sized by using, for example, a Markov Model where the size of the position can be a function of the regime transition probability [1]. While this is a research venue that we would like to explore, we decided to start with a simpler approach. We chose an algorithm that is intuitive enough for both quant and non-quant portfolio managers and traders.
We utilize the market timing rule proposed by Faber [2] who applied it to different asset classes in the context of portfolio allocation. The rule is as follows
Buy when monthly price > 10M SMA (10 Month Simple Moving Average)
Sell and move to cash when monthly price < 10M SMA
This remarkably simple timing rule has been used successfully by Faber and others. It has proved to significantly improve portfolios’ risk-adjusted returns [3].
Within the context of volatility trading, we compare 2 option strategies
1-NoTiming: Sell 1-Month at-the-money (ATM) put option on every option expiration Friday. The option is held until maturity, i.e. for a month. The position is kept delta neutral, i.e. it is rehedged at the end of every day.
2-10M-SMA: Similar to the above except that Faber’s timing rule is applied, i.e. we only sell an ATM put option if the closing price of the underlying is greater than its 10M SMA. Note, however, that unlike Faber, here we define the end of month as the option expiration Friday, and not the calendar end of month.
A short discussion on the rationale for choosing a market timing rule is in order here. Within the context of portfolio allocation, the 10M SMA rule is used for timing the direction of the market, i.e. the PnL driver is mostly market beta. Our trade’s PnL driver is, on the other hand, the dynamics of the implied/realized volatility spread. But as shown in a previous post, the IV/RV volatility dynamics correlates highly with the market returns. Therefore, we thought that we could use a directional timing strategy to size an options portfolio despite the fact that their PnL drivers are different, at least theoretically.
We tested the 2 strategies on SPY options from February 2007 to November 2016. Table below provides a summary of the trade statistics (average PnLs, winning/losing trades and drawdowns are in dollar).
| Strategy | NoTiming | 10M-SMA |
| Number of Trades | 115 | 81 |
| Percent Winners | 0.68 | 0.69 |
| Average P&L | 18.84 | 14.87 |
| Largest losing trade | -269.79 | -248.50 |
| Largest winning trade | 243.54 | 154.22 |
| Profit Factor (W/L) | 1.77 | 1.64 |
| Worst drawdown | -633.24 | -339.91 |
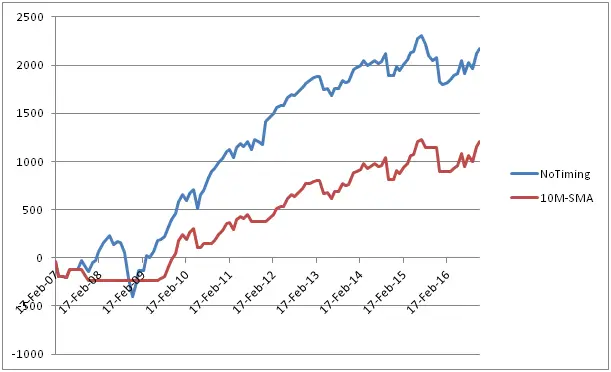
Graph below shows the equity curves of the 2 strategies

As it is observed from the Table and the Graph, except for the worst drawdown, we don’t see much of an improvement when the 10M-SMA timing rule is applied. Although the 10M-SMA strategy avoided the worst period of the Global Financial Crisis, overall it made less money than the NoTiming strategy.
The non-improvement of Faber’s rule in the context of volatility selling probably relates to the fact that we are using a directional timing algorithm to size a trade whose PnL driver is the volatility dynamics . A position sizing algorithm based directly on the volatility dynamics would have a better chance of success. We are currently extending our research in this direction; any comment, feedback is welcome.
References:
[1] C. Donninger, Timing the Tail-Risk-Protection of the SPY with VIX-Futures by a Hidden Markov Model. The Wool-Milk-Sow Strategy. April 2017, http://www.godotfinance.com/pdf/TailRiskProtectionHMM.pdf
[2] M. Faber, A Quantitative Approach to Tactical Asset Allocation, Journal of Investing , 16, 69-79, 2007
[3] See for example A. Clare, J. Seaton, P. Smith and S. Thomas, The Trend is Our Friend: Risk Parity, Momentum and Trend Following in Global Asset Allocation, Aug 2012, https://papers.ssrn.com/sol3/papers.cfm?abstract_id=2126478
