This post is a follow-up to the previous one on a simple system for hedging long exposure during a market downturn. It was inspired by H. Krishnan’s book The Second Leg Down, in which he referred to an interesting research paper [1] on the power-law behaviour of the equity indices. The paper states,
We find that the distributions for ∆t ≤4 days (1560 mins) are consistent with a power-law asymptotic behavior, characterized by an exponent α≈ 3, well outside the stable Levy regime 0 < α <2. .. For time scales longer than ∆t ≈4 days, our results are consistent with slow convergence to Gaussian behavior.
Basically, the paper says that the equity indices exhibit fatter tails in shorter time frames, from 1 to 4 days. We apply this idea to our breakout system. We’d like to see whether the 4-day rule manifests itself in this simple strategy. To do so, we use the same entry rule as before, but with a different exit rule. The entry and exit rules are as follows,
Short at the close when Close of today < lowest Close of the last 10 days
Cover at the close T days after entry (T=1,2,… 10)
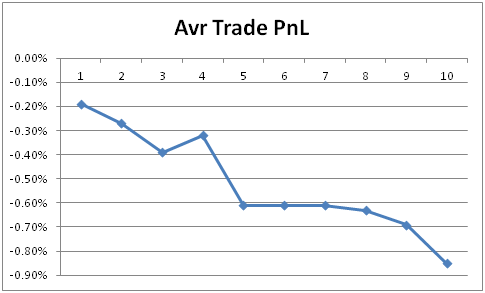
The system was backtested on SPY from 1993 to the present. Graph below shows the average trade PnL as a function of number of days in the trade,

We observe that if we exit this trade within 4 days of entry, the average loss (i.e. the cost of hedging) is in the range of -0.2% to -0.4%, i.e. an average of -0.29% per trade. From day 5, the loss becomes much larger (more than double), in the range of -0.6% to -0.85%. The smaller average loss incurred during the first 4 days might be a result of the fat-tail behaviour.
This test shows that there is some evidence that the scaling behaviour demonstrated in Ref [1] still holds true today, and it manifested itself in this system. More rigorous research should be conducted to confirm this.
References
[1] Gopikrishnan P, Plerou V, Nunes Amaral LA, Meyer M, Stanley HE, Scaling of the distribution of fluctuations of financial market indices, Phys Rev E, 60, 5305 (1999).
