It is commonly believed that commodity pairs are relatively easy to trade because their underlying stocks are pegged to a certain commodity market. Sometimes, however, this is not the case.
Gold stock pairs have been difficult to trade lately. One of the economic reasons is that as the gold spot declines, it approaches the production cost of around $1200 per ounce, and a small change in the spot would induce a big change (in percentage terms) in the profit margin of the producer. In other words, a small change in the spot would make a larger impact on the company’s profit and loss, thus causing a bigger fluctuation in the stock price. The big fluctuation magnifies the fundamental discrepancies inherent in the stocks of the pair. Consequently, deviations from the norm are likely due to more fundamental than statistical reasons. For quantitative traders who rely solely on statistics to make decision, it has been more difficult trading gold pairs profitably.
We can look at this problem from the options pricing theoretic point of view. The average production cost of $1200 per ounce can be considered a put option strike. If gold spot deeps below $1200, then the stock is considered in the money. Since late 2012 the “options” are near at the money, and gold stocks behave more or less like ATM options that have greater gamma risks.
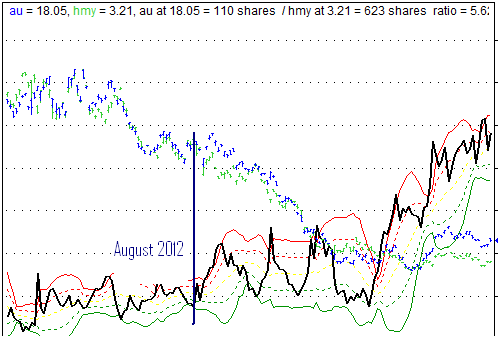
In the chart below, the solid black line shows the ratio of two gold stocks, AngloGold Ashanti (AU) v.s. Harmony Gold Mining (HMY). As it can be seen, starting August 2012 (marked with the blue vertical line), the declining in the stock prices started accelerating, and the oscillation in the pair ratio started increasing accordingly. Put it differently, the gamma has caused a greater oscillation in the pair ratio.

In the future, if gold spot trends up, the “options” will get out of the money, and the gamma risk will decrease. In this case gold stock pairs are expected to behave more regularly, thus providing better trade opportunities for statistical arbitrage traders.
