Volatility of Gold Pairs

It is commonly believed that commodity pairs are relatively easy to trade because their underlying stocks are pegged to a certain commodity market. Sometimes, however, this is not the case.

Gold stock pairs have been difficult to trade lately. One of the economic reasons is that as the gold spot declines, it approaches the production cost of around $1200 per ounce, and a small change in the spot would induce a big change (in percentage terms) in the profit margin of the producer. In other words, a small change in the spot would make a larger impact on the company’s profit and loss, thus causing a bigger fluctuation in the stock price. The big fluctuation magnifies the fundamental discrepancies inherent in the stocks of the pair. Consequently, deviations from the norm are likely due to more fundamental than statistical reasons. For quantitative traders who rely solely on statistics to make decision, it has been more difficult trading gold pairs profitably.

We can look at this problem from the options pricing theoretic point of view.  The average production cost of $1200 per ounce can be considered a put option strike. If gold spot deeps below $1200, then the stock is considered in the money. Since late 2012 the “options” are near at the money, and gold stocks behave more or less like ATM options that have greater gamma risks.

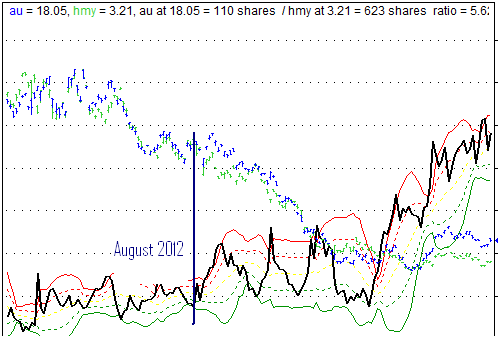
In the chart below, the solid black line shows the ratio of two gold stocks, AngloGold Ashanti (AU) v.s. Harmony Gold Mining (HMY). As it can be seen, starting August 2012 (marked with the blue vertical line), the declining in the stock prices started accelerating, and the oscillation in the pair ratio started increasing accordingly. Put it differently, the gamma has caused a greater oscillation in the pair ratio.

In the future, if gold spot trends up, the “options” will get out of the money, and the gamma risk will decrease. In this case gold stock pairs are expected to behave more regularly, thus providing better trade opportunities for statistical arbitrage traders.

Why Do Arbitrage Opportunities Still Exist?

A question arbitrageurs are frequently asked is “why aren’t the pricing inefficiencies arbitraged away?”  This is a very legitimate question.

I believe that in some areas of trading and investment, the number of arbitrage opportunity is diminishing. Take, for example, statistical arbitrage; its profitability is decreasing due to the increasing popularity of the method, competition among traders and advancement in information technology. In other areas of trading, opportunities still exist and persist. For example, in option trading, the volatility risk premium seems to persist despite the fact that it has become widely known.  Here are some possible explanations for the persistence of the volatility risk premium:

  • Due to regulatory pressures, banks have to meet Value-at-Risk requirements and prevent shortfalls. Therefore, they buy out-of-money puts, or OTC variance swaps to hedge the tail risks.
  • Asset management firms that want to guarantee a minimum performance and maintain a good Sharpe ratio must buy protective puts.
  • The favorite long-shot bias plays a role in inflating the prices of the puts.
  • There might be some utility effects that the traditional option pricing models are not capable of taking into account.
  • There are difficulties in implementing and executing an investment strategy that exploits the volatility risk premium and that is at the same time within the limits of margin requirements and drawdown tolerance.

We believe, however, that with a good understanding of the sources of cheapness and expensiveness of volatility, a sensible trading plan can be worked out to exploit the volatility risk premium within reasonable risk limits. We love to hear your suggestion.

Current Implied Volatility is Cheap

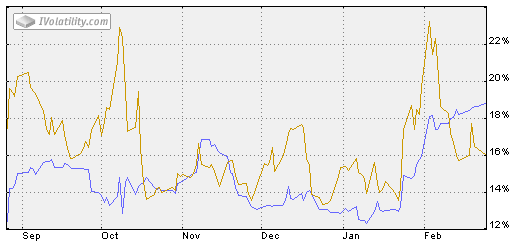
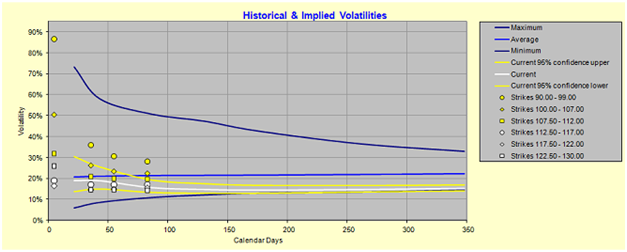
The phenomenon of the favorite long-shot bias (or volatility risk premium) can be exploited in order to construct a profitable options trading strategy. Basically, such a strategy would consist of selling overpriced options and hedging the risks using cheaper (or more precisely less overpriced) options. As can be seen from the graph below, the implied volatility (IV, yellow line) is generally higher than the historical volatility (HV, blue line). However, as of late, IV deepened below HV, which is rather unusual. A premium selling strategy in this kind of volatility environment might still profitable. However, the risks will likely outweigh the rewards.

The cheapness of IV is also confirmed by the volatility cone. As can be seen below, at the money IV, (depicted in white diamonds) is below the current HV (depicted by the white line).

A long volatility trade will have a higher probability of success in this kind of market.

The Favorite Long-shot Bias in Option Markets

The favorite long-shot bias is a phenomenon that has been studied extensively in gambling markets. A question has arisen naturally: does this bias exist in financial markets?

In a paper entitled “The Favorite /Long-shot Bias in S&P 500 and FTSE 100 Index Futures Options: The Return to Bets and the Cost of Insurance”, Hodges, Tompkins and Ziemba examined whether the favorite/long-shot bias that has been found in gambling markets (particularly in horse racing markets) applies to options markets. The motivation came from the fact that puts and calls on stock index futures represent leveraged short or long positions on the index and their behavior might have similar features to racetrack bets.

The authors found that both call and put options on the S&P 500 (and FTSE 100 to some degree) with one and three months to expiration display a relationship between probabilities of finishing in the money and expected returns that is very similar to the favorite long-shot bias in horse racing markets. In another word, they found evidence that was consistent with the hypothesis that investors tend to overpay for put options as the expected cost of insurance and call options as low-cost, high-payoff gambles.

This finding is consistent with results published by other researchers under the general framework of the volatility risk premium which refers to the fact that implied volatility in equity index options often tends to overstate realized volatility. In fact, the favorite/long-shot bias provides an alternative explanation for the existence of volatility risk premium.

For practitioners, a question arose: how to structure a position that takes advantage of the favorite long-shot bias?

Relative Pricing

Many popular trading strategies are based on some forms of fundamental or technical analysis. They attempt to value securities based on some fundamental multiples or technical indicators. These valuation techniques can be considered “absolute pricing”. Arbitrage trading strategies, on the other hand, are based on a so-called relative pricing. So what is relative pricing?

The theory and practice of relative pricing are derived from the principle of no arbitrage. Stephen A. Ross, a renowned professor of finance, is known for saying:

You can make even a parrot into a learned political economist—all he must learn are the two words “supply” and “demand”… To make the parrot into a learned financial economist, he only needs to learn the single word “arbitrage”.

What he was referring to is what financial economists call the principle of no risk-free arbitrage or the law of one price which states that: “Any two securities with identical future payouts, no matter how the future turns out, should have identical current prices.”

Relative pricing based on the principle of no risk-free arbitrage underlies most of the derivative pricing models in quantitative finance. That is, a security is valued based on the prices of other securities that are as similar to it as possible. For example an over-the-counter interest-rate swap is valued based on the prices of other traded swaps and not on, for example, some macro-economic factors. A bespoke basket option is valued based on the prices of its components’ vanilla options.

The principle of no risk-free arbitrage is employed in its original form in trading strategies such as convertible and volatility arbitrage. In statistical arbitrage  it is, however, relaxed; it normally involves stocks  which are similar but not 100% identical.

In summary, relative pricing based on the principle of no risk-free arbitrage is very different from absolute pricing. It is the foundation of many derivative pricing models and quantitative trading strategies.

Correlation Decreasing

Statistical arbitrage trading relies on, among other factors, the correlation between stocks. It is important to note, however, that correlation, like volatility, is not static, but time dependent and changing. Different market condition has a different level of correlation, and this has an important implication for stat-arb trading PnL.

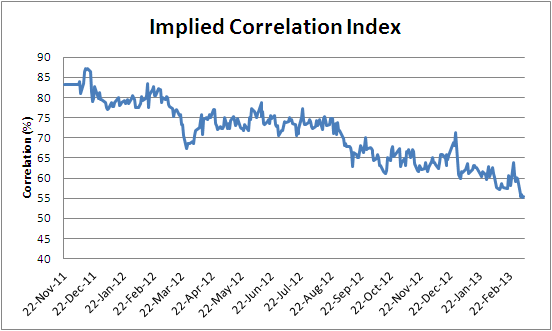
We have been in a bull market lately, and it’s fairly common in bull markets for correlations to relax. The chart below depicts the CBOE Implied Correlation Index for SP500 stocks from November 2011 to March 2013. As we can see from the graph, the correlation is in a downtrend; it decreased from 80 % in Dec 2011 to about 55% in early March 2013.

The decrease in correlation explains in part why we have observed lots of dislocated pair relationships lately.  This dislocation increased the likelihood of pair divergence, hence one should exercise more caution when choosing pairs.

Models for Beating the Market

Edward Thorp is believed to be the first quantitative hedge fund manager. He first developed a winning blackjack strategy, and later started a successful hedge fund that exploited the pricing inefficiencies in the warrant and convertible markets. During the holidays I revisited one of his articles published in 2003 “A Perspective on Quantitative Finance, Models for Beating the Markets”. In this article Thorp recounted stories how he developed models for making money in blackjack and convertible bond hedging, respectively. According to him, developing a successful trading business  involves three steps:

  1. Idea,
  2. Development,
  3. Successful real world Implementation.

Most of the ideas (Step 1) in statistical arbitrage are more or less well known these days. To successfully build a quantitative trading business we need to complete Steps 2 and 3; we would need the following skills:

  1. Visionary,
  2. Quantitative,
  3. Entrepreneurial

Do you have the required relevant skills? If you’re missing one of these skills then learn it, improve it or team up with someone who already has it.

Happy Trading !!!

Arbitrage

Arbitrage is the process of buying assets in one market and selling them in another to profit from price differences. True arbitrage is both riskless and self-financing. In today’s modern financial markets with ultra-fast supercomputers riskless arbitrage rarely exists. Arbitrage strategies still work, but they’re often not risk-free. These strategies include (but not limited to):

  • Statistical arbitrage (pairs, basket trading): mostly involves equities and other instruments whose payoffs are linear.
  • Volatility arbitrage: involves different classes of options on a single or multiple underlyings. The payoffs of those options are not linear, i.e. they have convexities.
  • Convertible arbitrage: consists of a hybrid (equity + debt) instrument and a hedge.
  • Sport arbitrage: refers to inter-market arbitrage. It can also mean profiting from a bookmaker’s mispricing of sport matches.